Bird flu comes from outside, so that is where we look too
Bird flu usually comes in via wild waterfowl. In the Netherlands, reports of dead wild birds are the earliest sign that the virus is nearby.
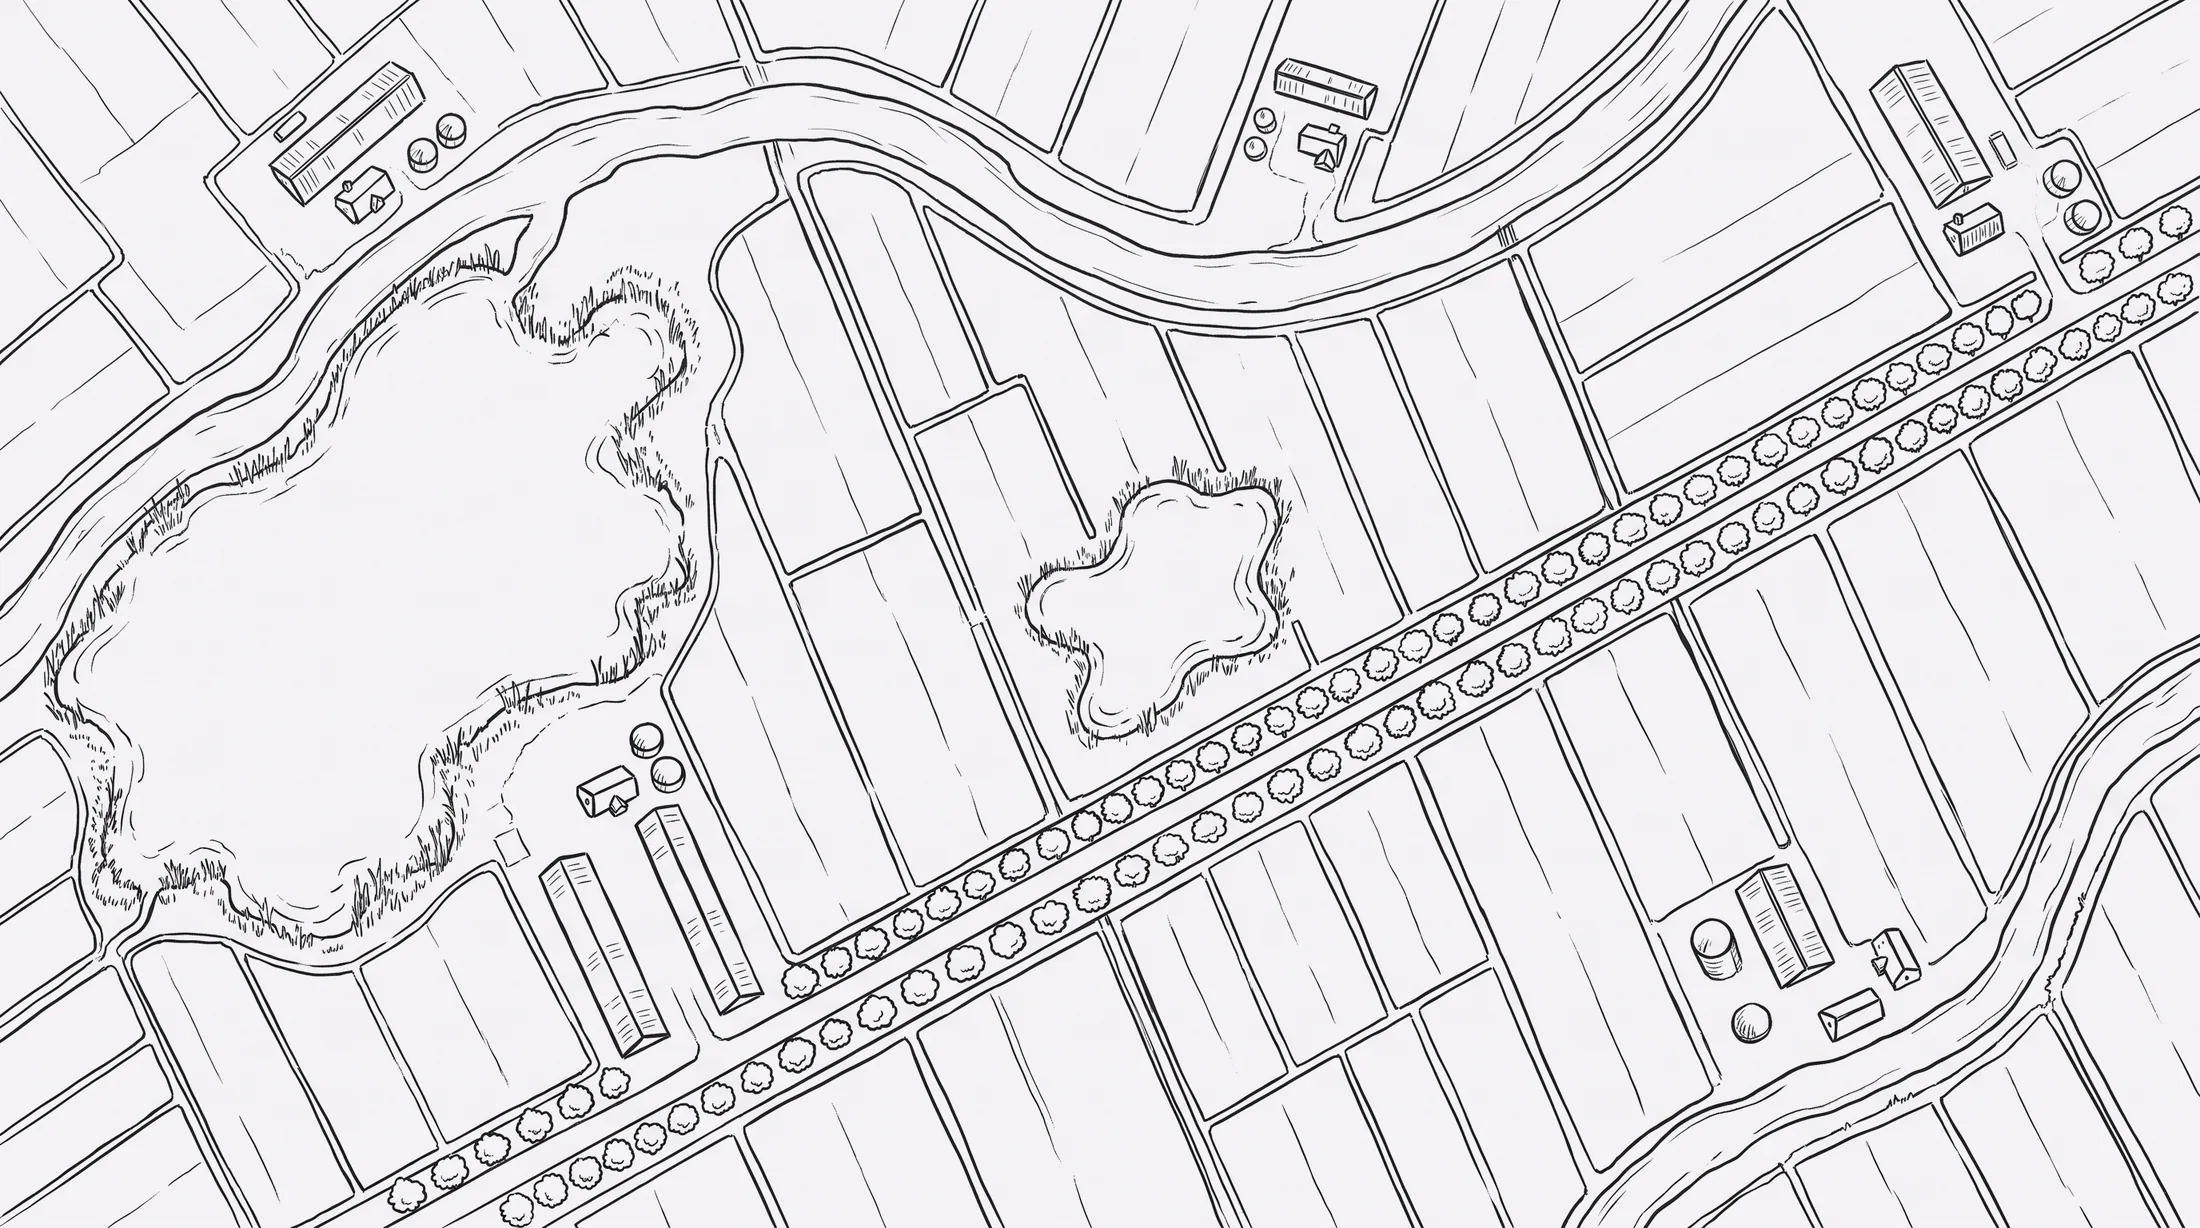
Move your mouse over a hexagon to see what is in it.Tap a hexagon to see what is in it.
HEN0 divides the land into hexagons of about one kilometre and looks at the landscape in each hexagon down to 10 metres.
For each hexagon it counts wild bird reports, earlier outbreaks, the weather and the landscape on satellite images. A risk follows from that.
So you do not just see that the season is starting, but whether it is coming your way.
If the risk in your hexagon rises, a deviating signal from your barn carries more weight.
The system points out where and when a test or measure pays off. Then you do not have to step up everywhere at once.
How the on-farm test worksRestriction zones are now circles on a map
Anyone inside is locked down, even if nothing is wrong on their own farm. As long as nobody knows better, that is understandable.
If the pressure from outside and the situation inside are both measured continuously, a zone can follow the real risks. We are not there yet. The first models are rough and indicative.
Why a hexagon and not a circle
A circle around an outbreak is easy to draw, but takes no account of what lies beneath it. Water, migration routes, traffic between farms and the landscape determine how high the risk is in a given place.
Every hexagon is the same size and has the same number of neighbours. That way you compare areas fairly and follow the risk over time.
Where the data comes from
We work with public sources: reports of dead wild birds, confirmed outbreak locations and satellite images of the landscape. The first version contains 178 outbreaks and over 1,500 reports of dead wild birds.
We are saving tracking wild birds from space for later.